Inspiration und interessante Projekte, Artikel, Leute und so
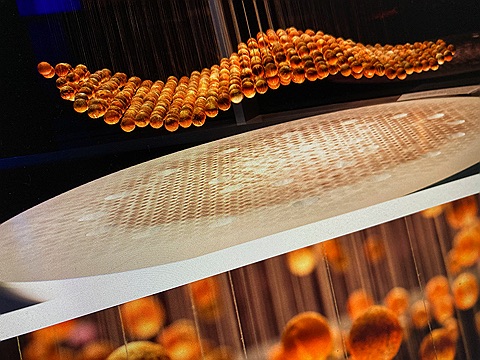
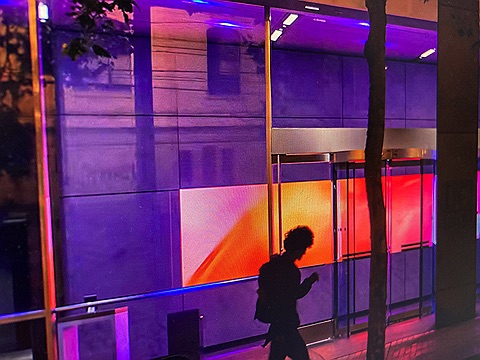
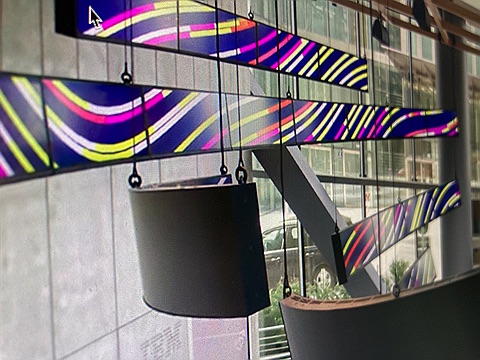
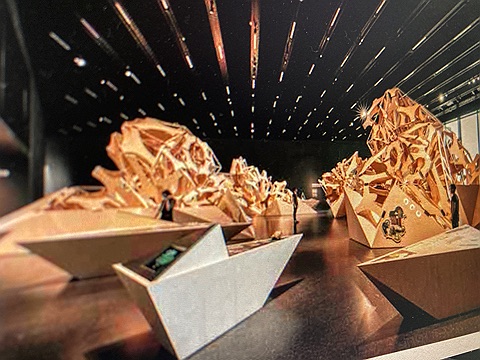
Breaking Wave open_in_new
Breaking Wave is an anamorphic kinetic sculpture created for Biogen-Idec's new headquarters in Cambridge, MA.
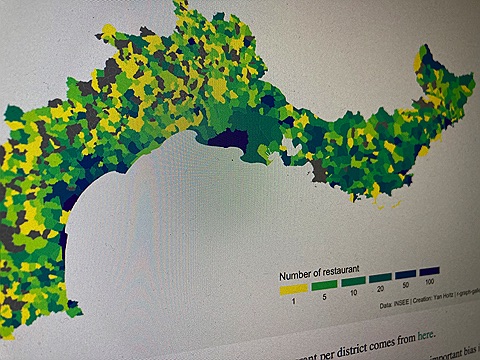
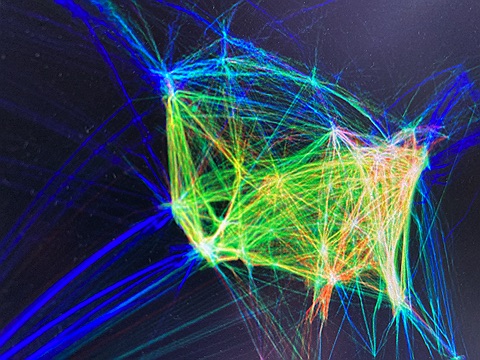
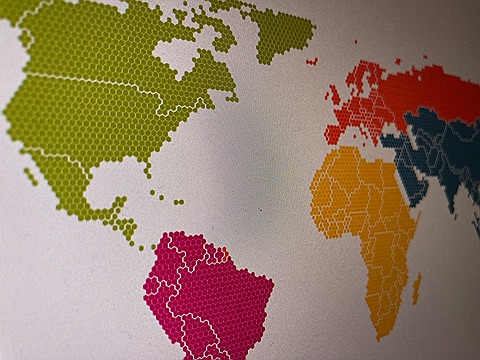
choropleth-map open_in_new
A choropleth map displays divided geographical areas or regions that are coloured in relation to a numeric variable.
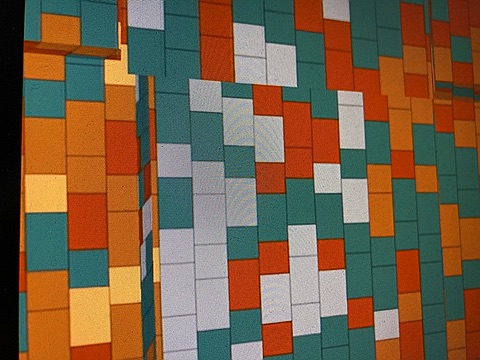
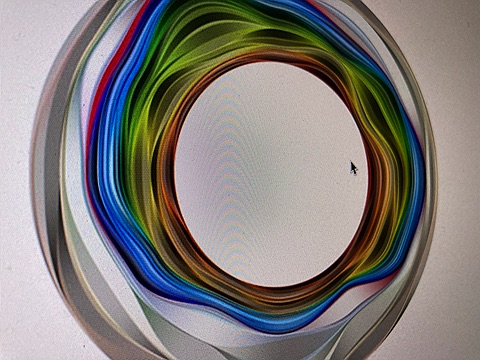
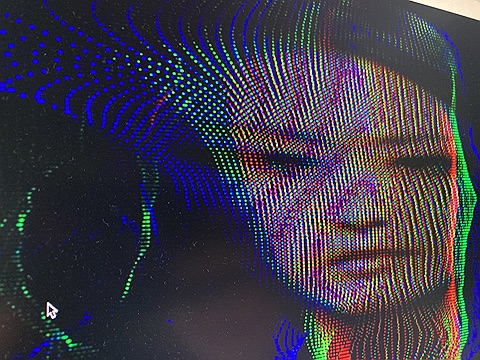
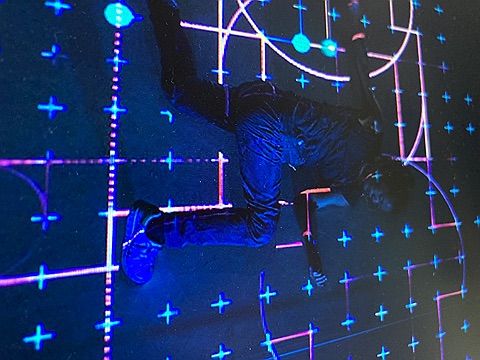
Collide open_in_new
Collide is an exploration of the senses by transforming recorded motion data into abstract visuals and sound.
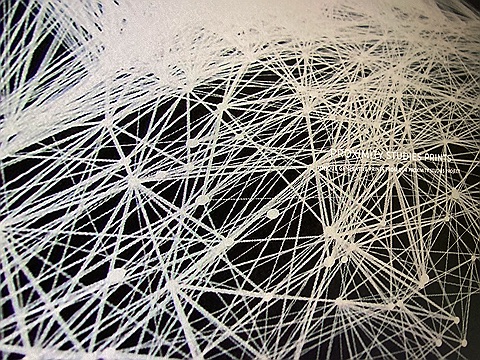
facebook-tree open_in_new
This abstract data illustration highlights the store’s communication by visualizing the interaction of users online.
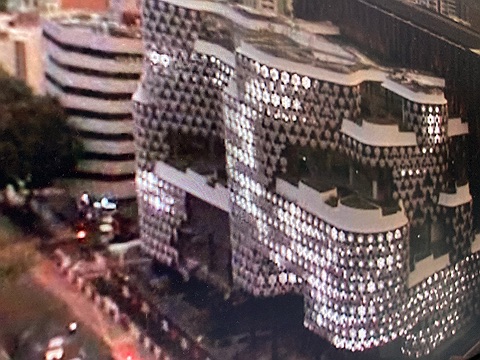
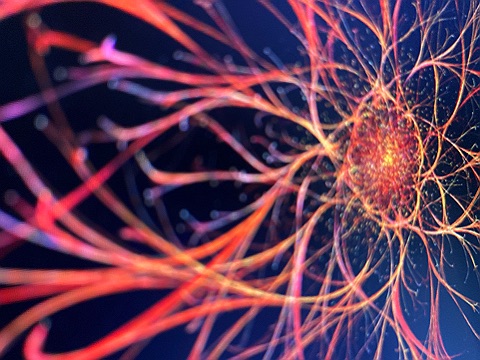
IBM Flux open_in_new
FLUX is a data-driven art installation visualizing the different facets of the Internet of Things and cognitive technologies.
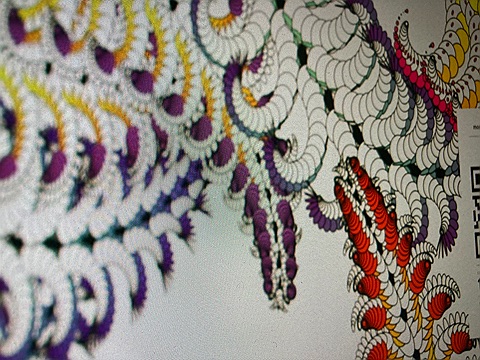
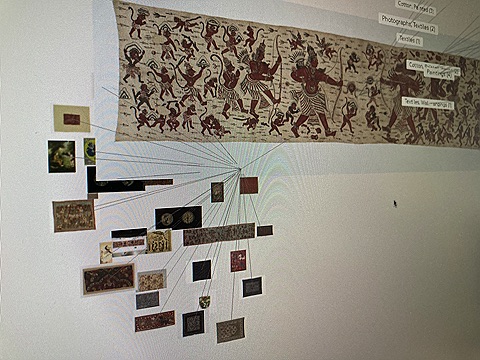
interwoven-map open_in_new
INTERWOVEN uses AI and machine learning to reveal connections between MAP's collection of South Asian textiles and artworks from different cultures.
jller open_in_new
Jller is part of an ongoing research project in the fields of industrial automation and historical geology.
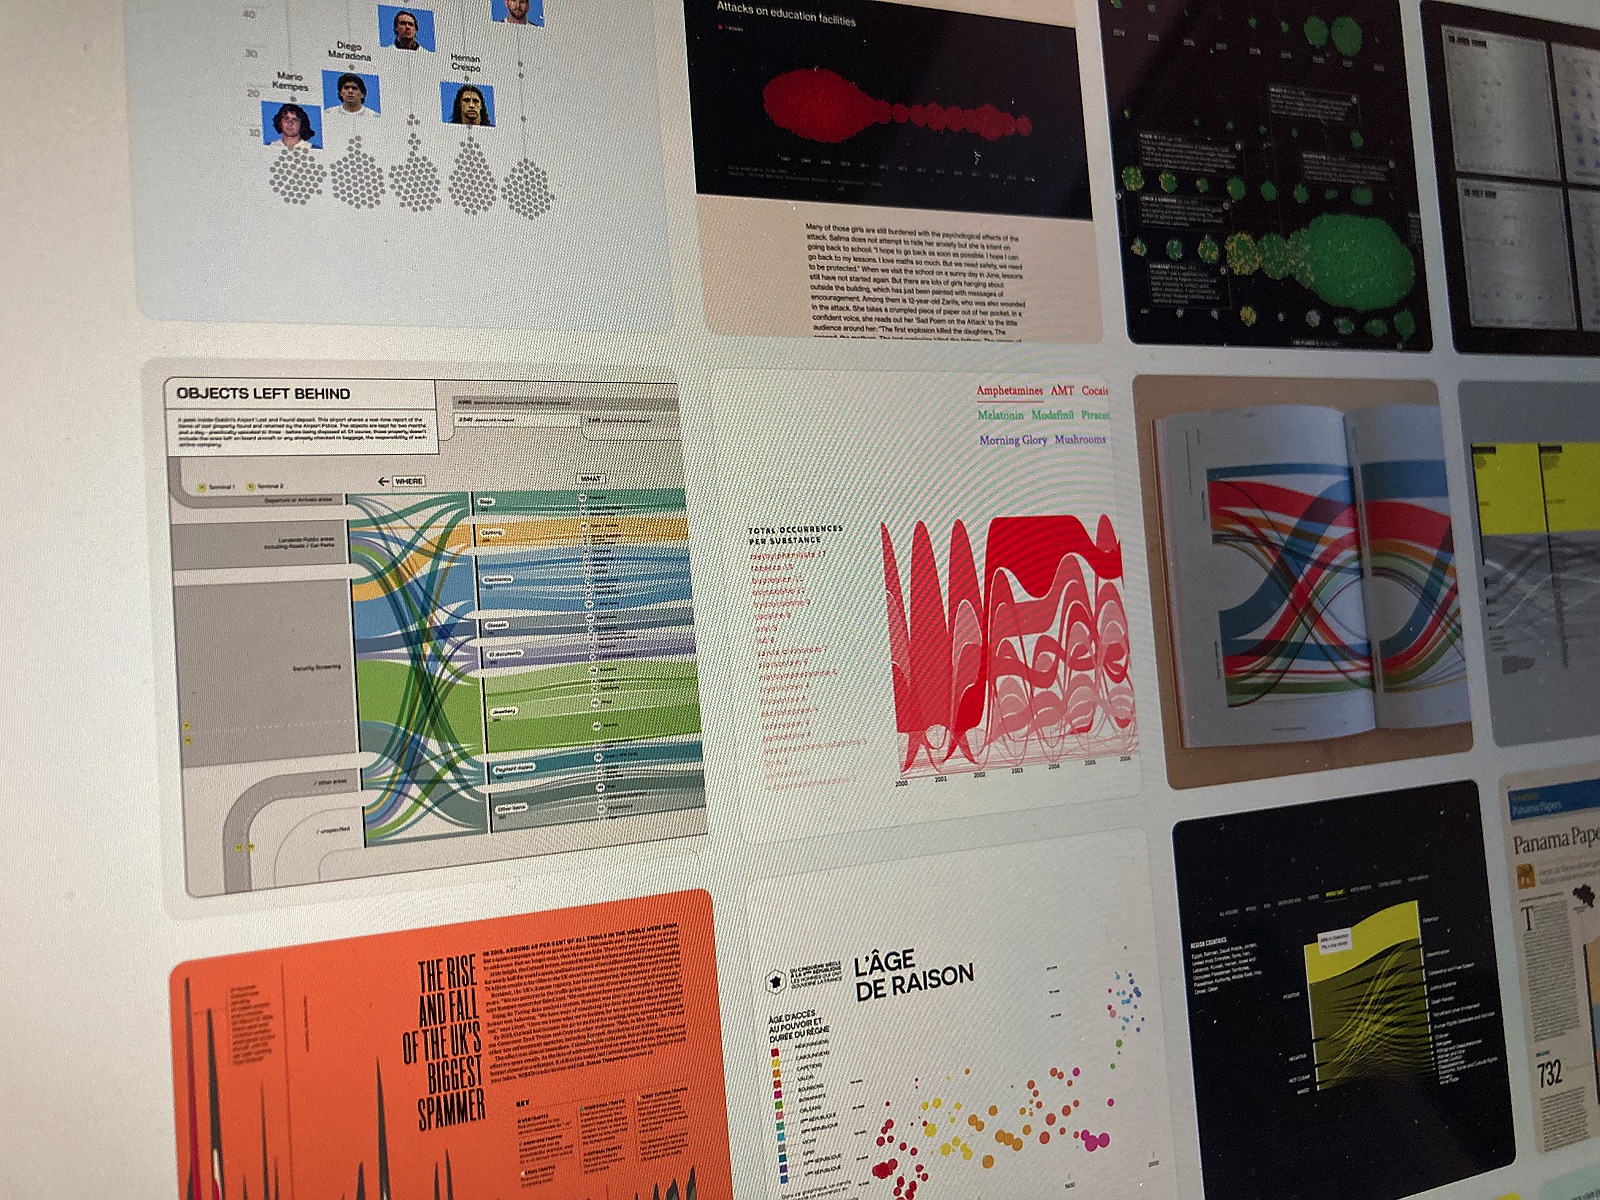
Kultur Design open_in_new
Kultur Design is a creative agency specialising in data visualisation, information design, web applications & generative design.
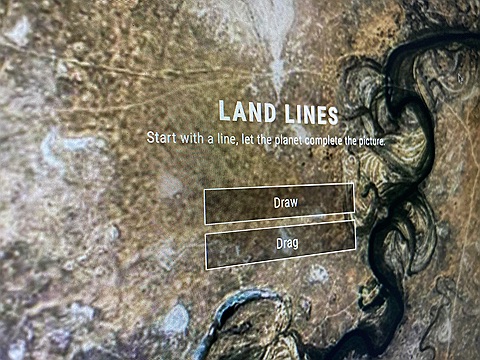
land-lines open_in_new
Land Lines is an experiment that lets you explore Google Earth satellite imagery through gesture. “Draw” to find satellite images that match your every line; “Drag” to create an infinite line of connected rivers, highways and coastlines.
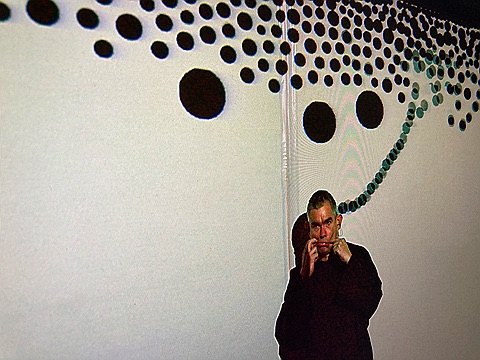
messa-di-voice open_in_new
Messa di Voce augments the speech, shouts and songs produced by two virtuoso vocalists with real-time interactive visualizations.
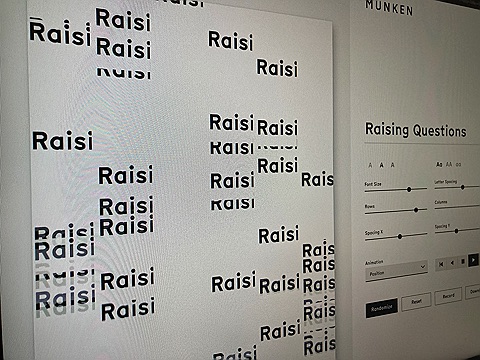
munken open_in_new
The Munken Creator uses browser-based reactive user interface that allows the user to see changes in real time and adjust the design according to their preferences.
Pathfinder open_in_new
Pathfinder is a generative approach for the conceptual choreographic research of body movements.
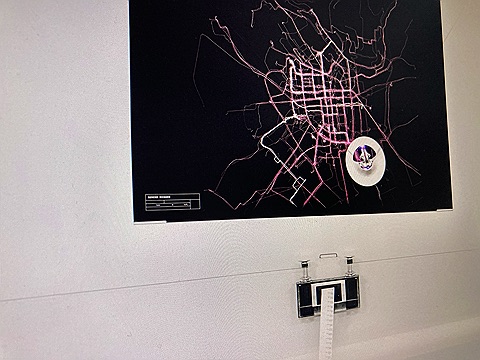
radwende open_in_new
Die Radwende-App zeichnet die gefahrenen Strecken der Nutzer auf, bündelt diese und visualisiert sie in einer digitalen Karte.
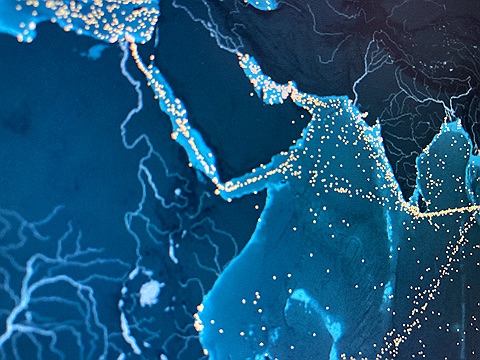
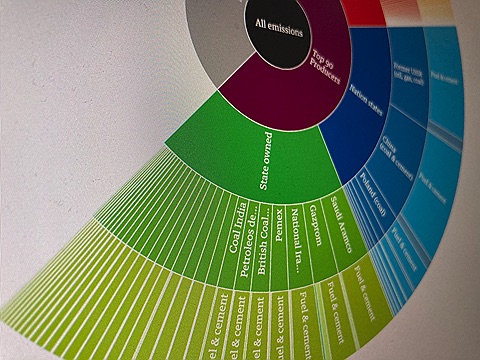
shipmap open_in_new
The Data Visualization shows the movements of the global merchant fleet over the course of 2012, overlaid on a bathymetric map. You can also see a few statistics such as a counter for emitted CO2 and maximum freight carried by represented vessels.
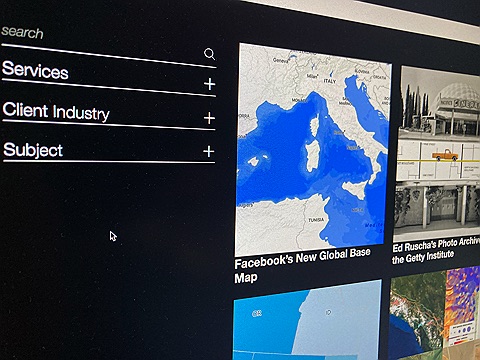
Stamen open_in_new
Stamen is a data visualization and cartography design studio, based in the Mission District of San Francisco and founded by Eric Rodenbeck in 2001.
the-body open_in_new
The moving sound sculpture is based on the recorded motion data of a real person.